Debugging
Here's a list of tips & tricks you can use when your test suite isn't working the way you've intended.
View source
If the screenshots aren't looking right you can use the "View source" feature. You'll find it in the "…" overflow menu to the right of a screenshot. For a diff, the menu has separate "View source for before image…" and "View source for after image…" options:
You'll land on the Source page. It looks something like this: 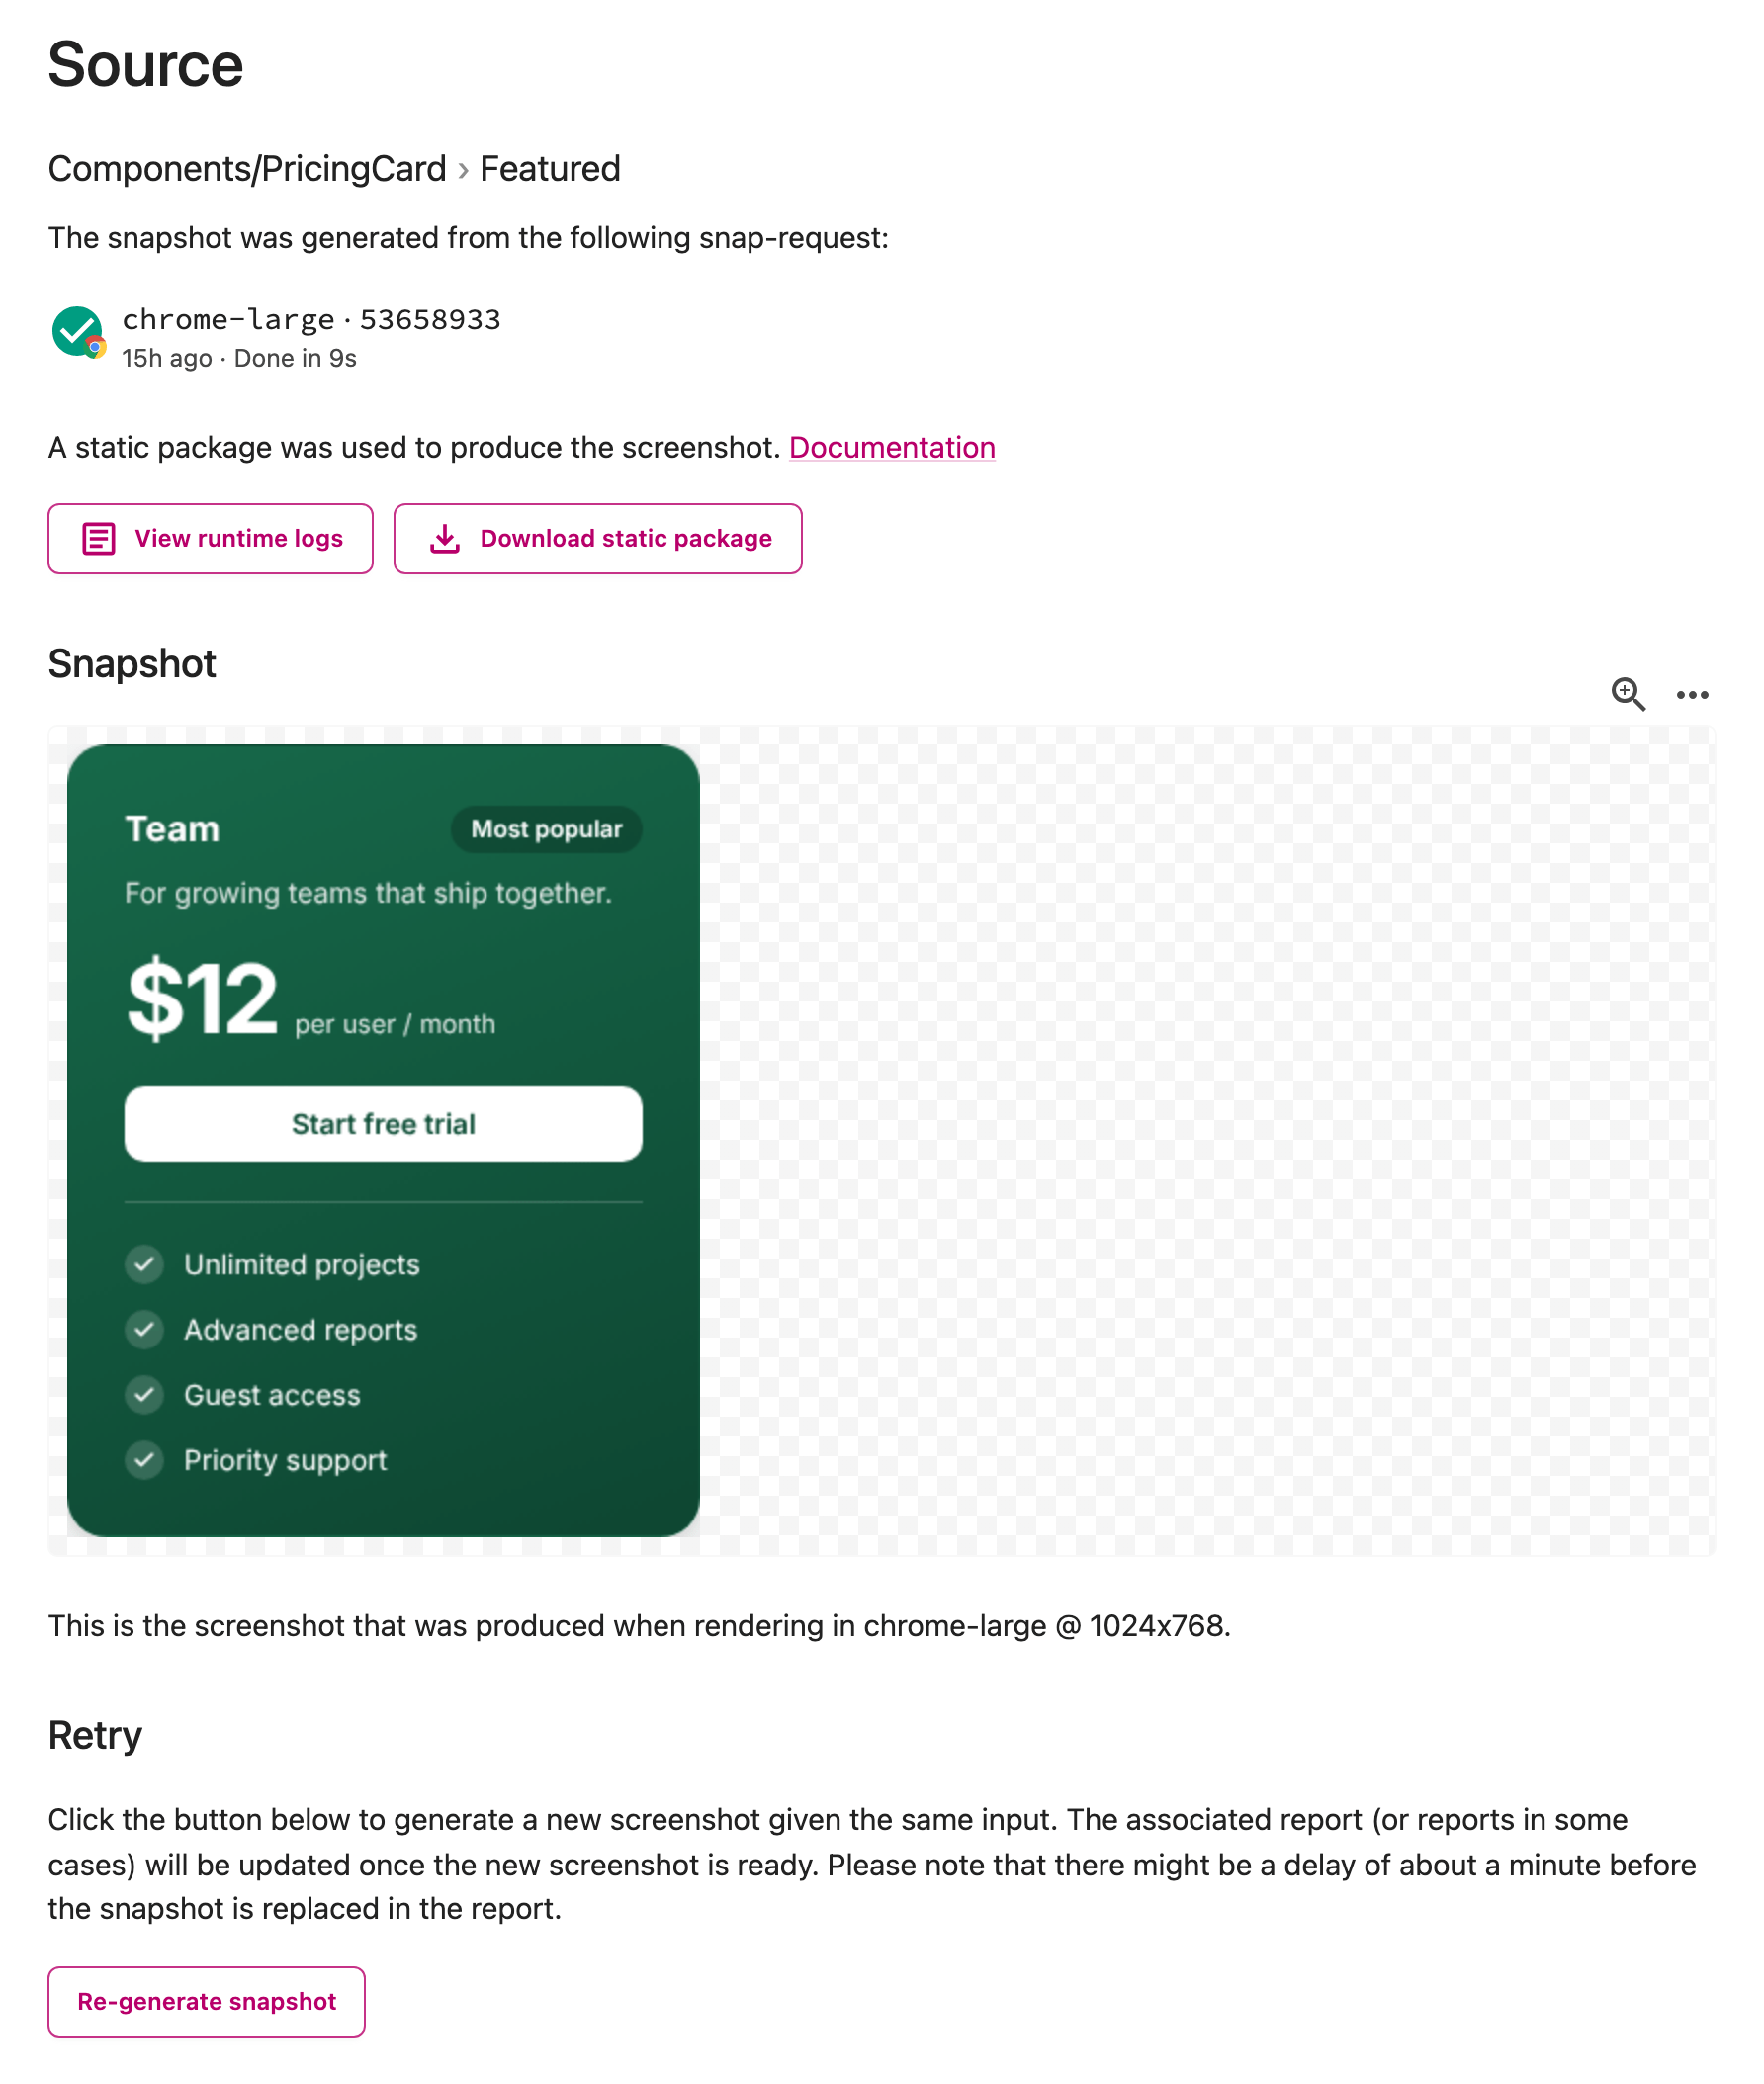 The Source page for a "PricingCard" snapshot
The Source page has some details about what was used to produce the screenshot, and there are a few buttons here that can be useful. Depending on the type of integration you are using, you'll see one or more of these buttons:
- A "View recorded HTML" button (for Cypress setups) that allow you to see the rendered HTML directly in the browser, along with the CSS used.
- A "Download assets" button, where you can grab the images, fonts, etc, that were used when taking the screenshot.
- A "Download static package" button that let's you fetch the statically built package used to render the example. This will e.g. show up if you're using Storybook or the custom integration.
- A "Re-generate snapshot" button, that will let you retry taking the screenshot. Continue reading for more on this option!
Re-generate snapshot
If you are using an up-to-date happo package v6.0.0 or later, you can tell Happo to retry taking the screenshot. Once that's done, the associated report (or reports in some cases) will be updated to use the new screenshot. Please note that updating the reports can take a minute or two to fully propagate (because of caching).
Static package downloads
When you download a static package as a zip file, you can debug the source locally by following these steps:
- Unzip the downloaded file
- Start a http server in the unzipped folder (
http-serveris a good option) - Check the URL where the server is started and open
http://localhost:8080/iframe.htmlin your browser (replace8080with the port used for your server). - Wait for the page to load, then open up a JavaScript console and run
window.happo.nextExample(). - See your first component load.
- Keep calling
window.happo.nextExample()to iterate through your components.
If you quickly want to iterate through all components, copy and paste this script in the JavaScript console:
window.happo.init({ chunk: { index: 0, total: 1 } });
var renderIter = function () {
  window.happo.nextExample().then(function (a) {
    if (!a) {
      return;
    }
    console.log(a);
    requestAnimationFrame(() => renderIter());
  });
};
renderIter();
Profiling static packages
When debugging performance issues or memory leaks in your static packages, Chrome DevTools provides powerful profiling tools. Here's how to use them:
Running the profiler in Chrome DevTools
- Open Chrome DevTools (F12 or Cmd+Option+I on Mac)
- Navigate to the Performance tab
- Click the Record button (or press Cmd+E / Ctrl+E)
- Interact with your static package (e.g., call
window.happo.nextExample()to cycle through components, or use therenderIter()setup described above) - Click Stop when you're done recording
- Analyze the timeline to identify performance bottlenecks, long tasks, or memory issues
Creating a heap snapshot for Detached Nodes
Detached Nodes are DOM elements that have been removed from the document tree but are still referenced in JavaScript, preventing garbage collection and causing memory leaks. This is a common source of slowness in Happo test suites, and can cause instability (browser crashes, timeouts) on the Happo workers.
To identify Detached Nodes:
- Open Chrome DevTools and go to the Memory tab
- Select Detached elements in the list of profiling types
- Click Take snapshot
- Review the list of detached nodes to identify which elements are not being properly cleaned up
Tips for getting rid of Detached Nodes
Detached Nodes often occur when event listeners, timers, or references to DOM elements aren't cleaned up when components unmount. Here's a React example showing the problem and solution:
Before (causing Detached Nodes):
function MyComponent() {
  const [count, setCount] = useState(0);

  // ❌ Event listener is never cleaned up
  useEffect(() => {
    const handleClick = () => {
      setCount((c) => c + 1);
    };
    document.addEventListener('click', handleClick);
  }, []);

  return <div>Count: {count}</div>;
}
After (properly cleaned up):
function MyComponent() {
  const [count, setCount] = useState(0);

  // ✅ Event listener is cleaned up on unmount
  useEffect(() => {
    const handleClick = () => {
      setCount((c) => c + 1);
    };
    document.addEventListener('click', handleClick);

    // Cleanup function removes the event listener
    return () => {
      document.removeEventListener('click', handleClick);
    };
  }, []);

  return <div>Count: {count}</div>;
}
Common sources of Detached Nodes and how to fix them:
- Event listeners: Always remove event listeners in the cleanup function of
useEffect - Timers: Clear
setIntervalandsetTimeoutin cleanup functions - Subscriptions: Unsubscribe from observables, WebSocket connections, or other subscriptions
- DOM references: Avoid storing references to DOM elements in component state or refs that persist after unmount
Missing fonts, images, or other external assets
If a snapshot renders without a webfont, an image, or anything else it loads from another host, the request may have been refused before it left the browser. That happens when the target sets allowedHostnames and the host isn't on the list.
Open the report's logs page in happo.io to find out, with the View logs link at the bottom of the report's sidebar:
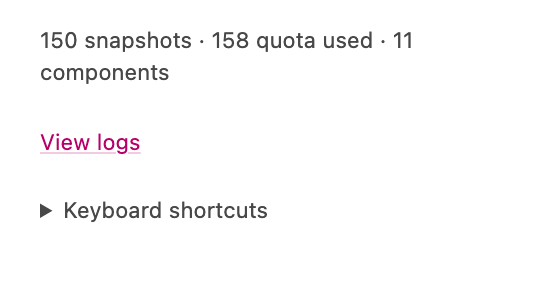
The logs page opens with a summary of what the run reached for on the network, split into what was allowed and what was blocked, and naming each hostname:
External requests: 2 allowed, 3 blocked. Allowed: example.com (x2). Blocked: fonts.gstatic.com (x2), cdn.example.com
Add the hostnames you need to the target's allowedHostnames and run again. Anything still missing after that came from somewhere else — start with View source to see what the page actually rendered.
Two things worth knowing:
- Requests to the worker's own server (the page being rendered, and everything in your uploaded package) are always allowed and never appear in the list. Neither do
data:andblob:URLs, which never hit the network. allowedHostnameshas no effect onios-safariandipad-safari. A target that sets it there says so in its log rather than silently ignoring it.
Failed on worker
In some cases, your happo runs will fail with a Failed on worker message. In some cases, there's an additional error message that might hint at why the job failed. To see this error message, go to your Happo dashboard, look under "Snap-requests" and click on the one that has a failure icon.
Timed out while waiting for window.happo
Happo drives your test suite through a window.happo object that lives in the page. This error means the page loaded but that object never appeared, so there was nothing for the worker to render.
The error itself names the most likely cause — the worker looks around the page before giving up, and what it finds narrows things down a lot. The cases it distinguishes:
"Your Storybook loaded, but the Happo client runtime was never registered." The most common one, and the one most new Storybook setups hit. Either add
import 'happo/storybook/register';
or upgrade to happo v6.19.1 or later, which puts the client runtime into the built package for you and makes the import optional. (It still does something — it is also how you reach setThemeSwitcher, forceHappoScreenshot and the other helpers documented in the Storybook docs.)
"Happo's own runtime script is in the package but did not define window.happo." The runtime shipped, and the browser refused to run it. Nearly always a Content-Security-Policy meta tag or header in your Storybook that blocks same-origin scripts.
"Your Storybook package looks right, but its preview runtime never finished loading." The package is one we built, but the Storybook preview itself never came up. Download the static package and open iframe.html locally — the browser console will usually name the module that failed. It is also worth checking that your stories render in a plain storybook build output and not only under storybook dev.
"Nothing in the page identifies it as a prepared Happo package." On the Storybook integration, check that integration.configDir points at the right Storybook config directory, and that the package was built by the happo CLI rather than uploaded as a raw storybook build output. On the custom integration, check that your own bundle defines window.happo with init and nextExample functions.
From v6.19.1 the CLI also checks the built package before uploading it, so a Storybook that has nowhere to put the runtime, or that contains no stories at all, fails on your own terminal instead of several minutes later on a worker.
Stuck in loop processing examples
If your happo run fails with an error like
Stuck in loop processing examples: encountered "Button, primary" a second time after processing 12 unique examples (last one before the repeat: "Badge, default").
it means Happo encountered the same component + variant pair twice while iterating through your examples. The pair in quotes first is the duplicate. The one after "last one before the repeat" is the last example that was successfully processed before Happo saw it, which is usually the better place to start looking.
The most common cause is two examples sharing the same component and variant name. Each example needs a unique component + variant combination, since Happo uses that pair as the identifier for the resulting screenshot. When two examples share the same identifier, the worker detects that it has already processed that screenshot and bails out rather than overwriting it.
Things to check:
- Duplicate Storybook stories. Two stories with the same
titleand story name (in the same or different files) will collide. Search your stories for the component and variant from the error message and remove or rename the duplicate. - Programmatically generated examples. If you're using the custom integration and generating examples in a loop (e.g. mapping over an array of fixtures), make sure each iteration produces a unique
variant. Duplicate keys in your source data, or a missing index/suffix in the variant name, will produce duplicates. - Custom
nextExampleimplementations. If you've implemented your ownwindow.happo.nextExample(), confirm that it advances its internal cursor on every call and returnsundefined(not the same example again) once all examples have been processed. A cursor that resets or fails to increment will make Happo loop back to an already-processed example.
To find the duplicate locally, download the static package from the Snap-request page and call window.happo.nextExample() repeatedly in the browser console until you see the same component + variant returned twice.